Step 6 : Access to the dashboarding service
The deployment of our dashboard being finished, we go back to the home page of DataTask from the menu by clicking on Portal.
A new Dashboard KPI application has appeared, click on it to access the dashboard.
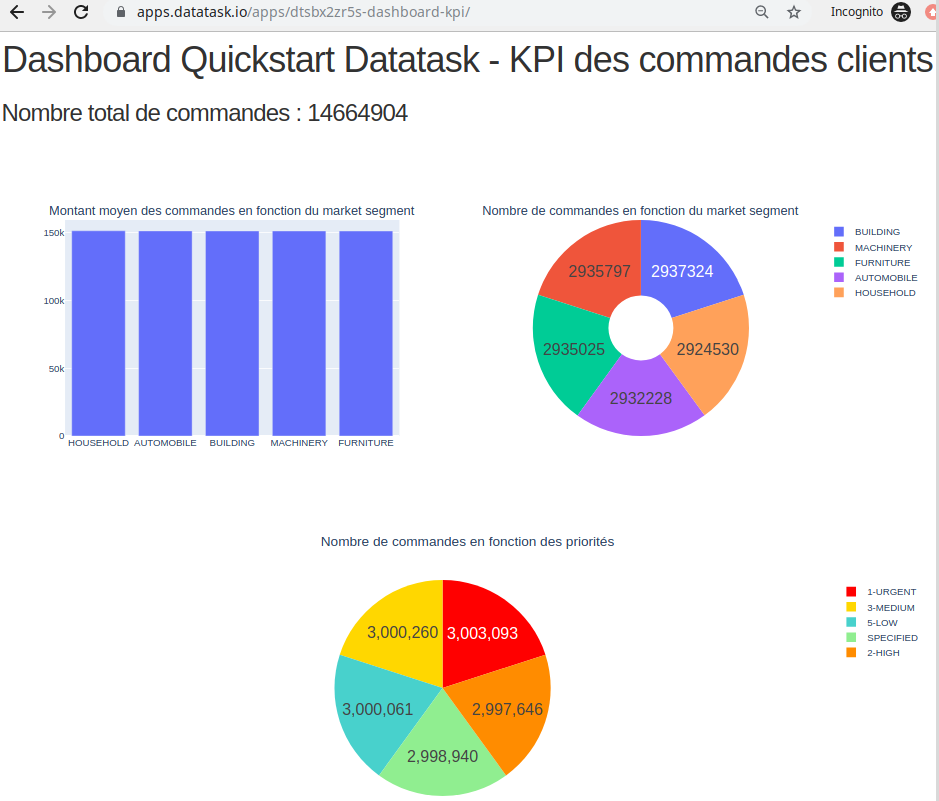
Let’s analyze our freshly deployed dashboard, we have different statistics on the customer orders shown in 3 different diagrams :
-
1 histogram showing the average amount of orders according to the customer’s market segment
-
1 donut showing the number of orders according to the customer’s market segment
-
1 pie chart showing the number of orders according to the priority type